


The text is from here.
Temperature observational result
Last updated on October 3, 2024.
The Institute of Environmental Science conducts temperature observations at several elementary schools in the city every year to understand the heat situation in the city, which has become hot due to global warming and the heat island phenomenon.
This page lists the 2024 temperature observational result and the past observational result.
For information on measures against heat in cities by the Institute of Environmental Science, see the City Heat Measures page.
Temperature observational result in July-August 2024 (summer)
In hot days were the highest ever, and some places recorded 14 consecutive days!
-The average temperature from July to August at all observation points is the highest ever.
The number of hot days at all the observed points (36 points) was the highest since the start of observations at the Institute of Environmental Science, the average temperature from July to August was also record highs, and the number of tropical nights was 32 points. It became severe heat throughout the city, including the highest number.
(Note)
- Hot day: Days when the maximum daily temperature is 35°C or higher
- Tropical night: Nights with a minimum temperature of 25°C or more from evening to the following day in Japan and North Korea
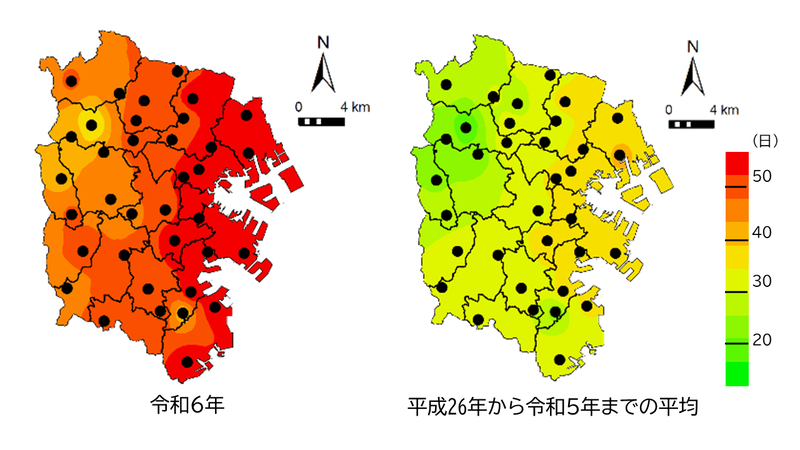
Number of hot days by location
- Recorded the highest number of hot days since the start of observation (2004)
- We observe many hot days from the north to the central part, and the number of hot days in the southern part tends to decrease.
- The maximum number of hot days observed at each point was 33 days (Ikumugi, Tsurumi-ku, Tsuzuki-ku), the minimum number was 5 days (Kashio-cho, Totsuka-ku).

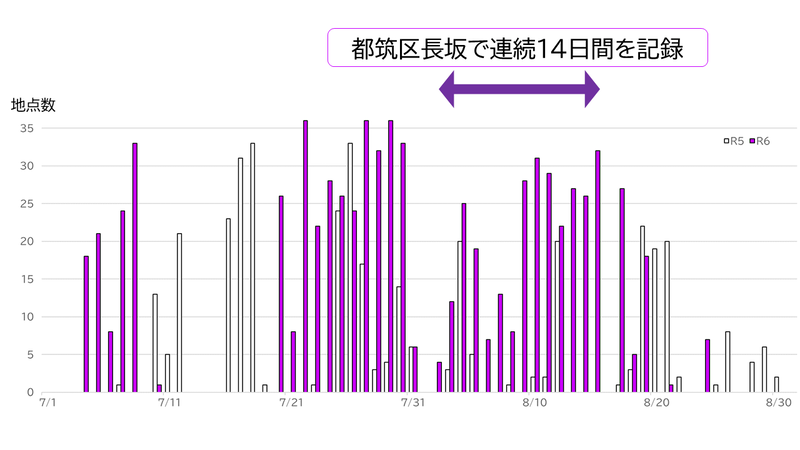
Distribution of the number of days of intense heat days
- Recorded more than 9 consecutive days of intense heat days at 21 locations, the largest number was 14 consecutive days (Tsuzuki-ku-ku-no-zaka).
- (In 2023, 7 consecutive days were the highest (Tsurumi-ku, Ikumugi, Tsuzuki-ku))
Changes in the number of observation points recorded on extremely hot days
Average temperature
Results by point
- High temperature in the northeastern part of the city, and in the western part of the city, it is less likely to be higher than in the eastern part of the city.
- The highest average temperature at each point is 29.8 ° C (Nishimachi, Tsurumi-ku, Isogo-ku), and the lowest is 28.4 ° C (Shinji-cho, Midori-ku).
- Compared to the past 10 years from 2014 to 2023, it was the highest at all points.
- It was 1.5 to 2.4°C higher than the average for the past 10 years from 2014 to 2023 at each point.

Average temperature distribution map
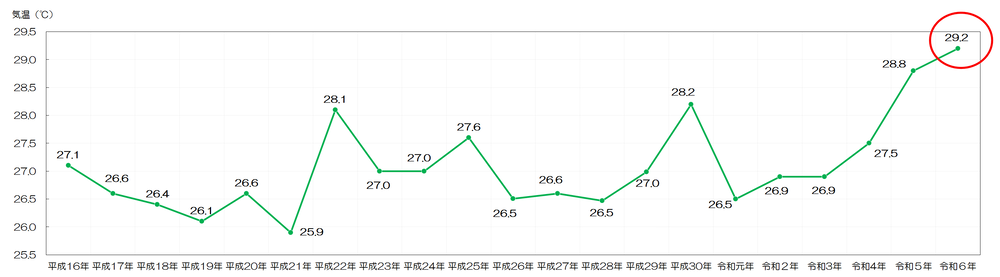
Results of all points
The average temperature at all locations was 29.2°C, a record high since the start of observations at the Institute for Environmental Science.
Number of tropical nights by location
- Tropical nights tend to occur in the eastern part of the city
- The maximum number of tropical nights observed at each point was 57 days (Ikumugi, Tsurumi-ku, Shinyoshida-Higashi and Kikuna, Kohoku-ku), and the minimum number was 29 days (Shinji-cho, Midori-ku).
Tropical Night Number Distribution Map
Press Release in 2024
2024 and Past Temperature observational result
2024 and past temperature observational result (Excel: 11KB)
This is a list of temperature observational result in the past 10 years from 2014 to 2023 and 2024.
Past press release materials
Temperature observational result in Yokohama City in the summer of 2013 (PDF: 434KB)
Temperature observational result in Yokohama City in the summer of 2014 (PDF: 319KB)
Temperature observational result in Yokohama City in the summer of 2015 (PDF: 466KB)
Temperature observational result in Yokohama City in the summer of 2016 (PDF: 712KB)
Temperature observational result in Yokohama City in the summer of 2017 (PDF: 804KB)
Temperature observational result in Yokohama City in the summer of 2018 (PDF: 820KB)
Temperature observational result in Yokohama City in the summer of 2019 (PDF: 456KB)
Temperature observational result in Yokohama City in the summer of 2020 (PDF: 634KB)
Temperature observational result in Yokohama City in the summer of 2021 (PDF: 1,312KB)
Temperature observational result in Yokohama City in the summer of 2022 (PDF: 1,612KB)
Temperature observational result in Yokohama City in the summer of 2023 (PDF: 2,012KB)
Temperature observational result in Yokohama City in September 2023 (PDF: 1,593KB)
Related links
Temperature Observation in the City
Measures against heat in cities
You may need a separate PDF reader to open a PDF file.
If you do not have it, you can download it free of charge from Adobe.
![]() To download Adobe Acrobat Reader DC
To download Adobe Acrobat Reader DC
Inquiries to this page
Green Environment Bureau Institute of Environmental Science, Environmental Conservation Department
Phone: 045-453-2550
Phone: 045-453-2550
Fax: 045-453-2560
E-Mail address [email protected]
Page ID: 470-390-206


