


- Yokohama-shi Top Page
- Living, procedures
- Community Development and Environment
- Environmental Conservation
- Survey and observation
- Institute for Environmental Science
- Business description
- Measures against heat in cities
- Efforts of the Institute for Environmental Science
- Temperature Observation in the City
The text is from here.
Temperature Observation in the City
Last updated on February 3, 2025.
The Institute of Environmental Science conducts temperature observations at several elementary schools in the city to understand the heat situation in the city, which has become hot due to global warming and the heat island phenomenon.
This page introduces the tendency of heat in the city known in previous surveys. .
For more information about observational result and past observational result, please visit the Temperature observational result page.
Heat Island Countermeasures Related Page in Yokohama City
What is the Heat Island phenomenon? / Leaflet "Creating an environment that overcomes the heat" / Temperature Observation in the City / Heat Environment Survey / Future forecast of city temperature
Trends of heat in the city
There are regional differences in the heat of the city!
As a result of a survey conducted by the Institute of Environmental Science, it has been found that there are regional differences in the heat conditions in the city, and that areas that tend to be hot during the day and at night are different.
- The average temperature is hot in the northeastern part of the city, and in the western part of the city, it is less likely to be hot than in the eastern part of the city.
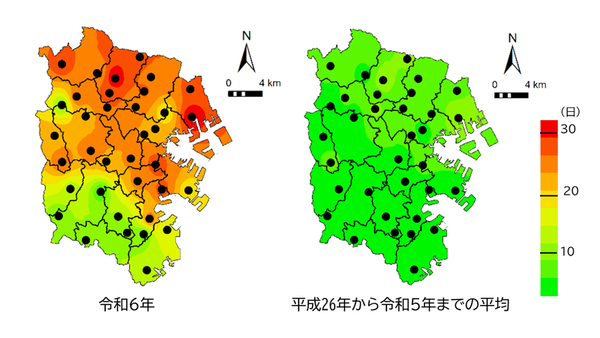
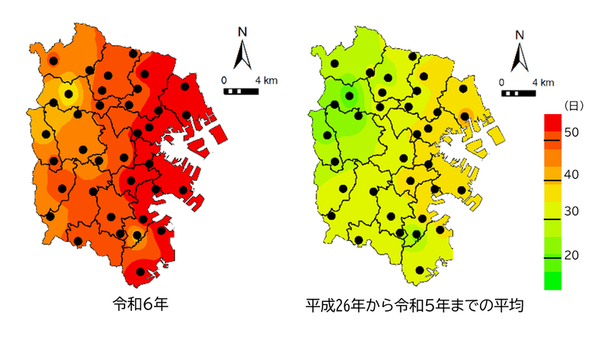
- The number of hot days is large from the northern part of the city to the central part of the city, and is small in the southern part of the city.
- Tropical nights tend to be higher in the eastern part of the city
These trends are generally consistent every year.
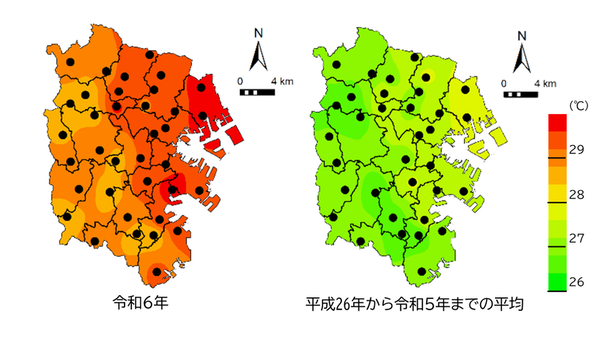
Average temperature distribution map from July to August
Distribution of the number of days of intense heat from July to August
Number of Tropical Nights from July to August
In addition, the guide for creating an environment that overcomes the heat using the urban environmental climate map introduces that winds blowing from the sea have the effect of suppressing the rise in temperature during the day, and green spaces have the effect of reducing nighttime temperatures. I am.
Depending on conditions such as the arrival time of the wind and the existence of green spaces, the areas that tend to be hot during the day and at night in the same city are different.
Detailed observational result (Click here for past observational result)
Detailed temperature observational result can be found on the Temperature observational result page.
The past observational result is also posted on this page.
Inquiries to this page
Green Environment Bureau Institute of Environmental Science, Environmental Conservation Department
Phone: 045-453-2550
Phone: 045-453-2550
Fax: 045-453-2560
E-Mail address [email protected]
Page ID: 155-586-512


